This is about the Universal Mary-Sue Litmus Test.
A lot has already been said about it; some disagree with the whole idea of a test, others support the idea, but debate the choice of specific questions. I’m trying to measure whether it works using statistics.
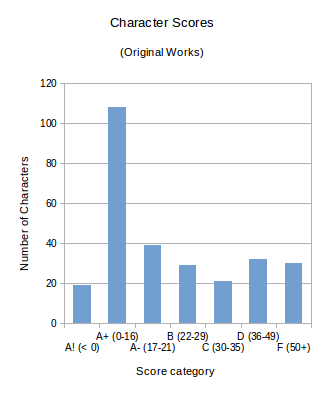
The number of characters who scored in each range on the test. Each bar is the number of characters I scored who got a particular explanation at the end.
From the characters I’ve scored so far (about 270; see the full list), it looks like it does.
According to the current version of the test, a good character (i.e. not a Mary Sue) should score below 30. On that basis, 195 of the characters I scored are probably OK — as the graph shows, a lot of them scored between 0 and 16, and over half scored less than 21 points.
Of course, this also means 80 of the characters I’ve scored probably are Sues.
So does that mean the test works? Well, that depends…
Specifically, it depends on whether they’re actually good characters. And unfortunately, I honestly don’t know. I’m looking at ways around this, but I haven’t got any useful results yet.
In the meantime, suppose most of the characters I scored are OK. Since the stories I scored are mostly professionally published, that should be a fairly safe bet. There might be a few bad apples (Twilight?), but I doubt the whole list is bad.
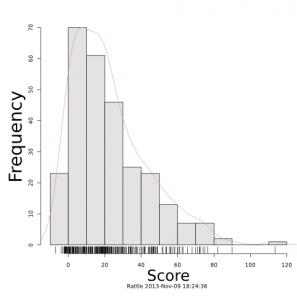
The frequency of various scores on the test.
If my list was mostly good characters, and the test works, then I’d expect most of the characters to get acceptable scores; and that’s exactly what I’m seeing.
This shows up more clearly in this second graph, which makes all the bars correspond to the same range of scores. The other graph makes D’s and F’s look more common than they should be, because they cover a broader range than the other letters.
It’s possible the proportion of failing scores is still a bit high; but it’s just as likely that a lot of the characters I scored aren’t actually that good.
Conclusion
Not much, so far. The scores from the test look about right, but that doesn’t prove it actually measures what it’s supposed to.
Data
Feel free to download my data file if you want to check my results, or do your own statistics. You can also click on the charts for more detailed descriptions.
Be aware that the test has changed since I started this project; the version of the test I used can be found in the Web Archive.

A Mary Sue Test and Statistics by “Isikyus” is licensed under a Creative Commons Attribution-NonCommercial 4.0 International License.