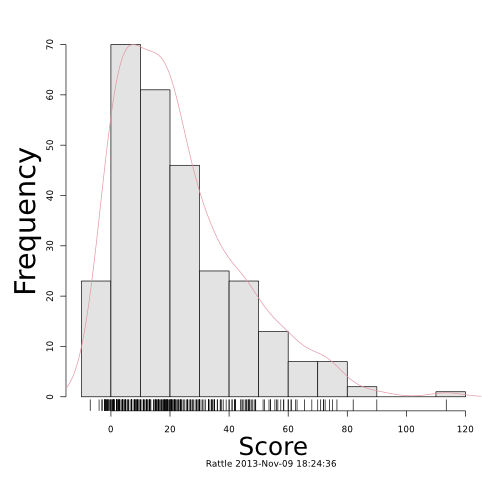
The frequency of various scores on the test.
The range of scores runs from about -20 to 90, with one score at around 110. The graph rises steeply from negative scores to the 0-10 range, which contains 70 scores, then falls a bit less sharply from 10 to 40 (30-40 and 40-50 each containing about 22 scores), and more gradually from there to 90.