This is about the Universal Mary-Sue Litmus Test.
A lot has already been said about it; some disagree with the whole idea of a test, others support the idea, but debate the choice of specific questions. I’m trying to measure whether it works using statistics.
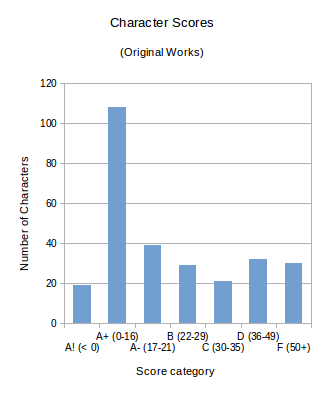
The number of characters who scored in each range on the test. Each bar is the number of characters I scored who got a particular explanation at the end.
From the characters I’ve scored so far (about 270; see the full list), it looks like it does.
According to the current version of the test, a good character (i.e. not a Mary Sue) should score below 30. On that basis, 195 of the characters I scored are probably OK — as the graph shows, a lot of them scored between 0 and 16, and over half scored less than 21 points.
Of course, this also means 80 of the characters I’ve scored probably are Sues.
So does that mean the test works? Well, that depends…